1 Introduction
The amount of data collected across domains in science, medicine, business, humanities, engineering, and the arts in the past decade has exploded. Sensors and internet-enabled devices, such as smart phones, deliver data to databases stored in the cloud; scientific experiments at The Large Hadron Collider (LHC) particle accelerator at CERN produce approximately 30 petabytes (30 million gigabytes) of data annually,2 Facebook processes 2.5 billion pieces of content and more than 500 TB of data each day,3 and health information is often stored in electronic health records. Data collection has been an important part of science throughout history, but these examples show that people working in scientific, business, and other areas will encounter data collection, so understanding it is important in this data-driven era.
A study is an empirical investigation of the relationship between effects and treatments . This book introduces the reader to the fundamental principles of study design using computation and simulation. In general, a study design includes all activities that precede data analysis including what data to collect, and where, when, and how it will be collected. An important aspect of study design is framing a scientific question, testable with data, to address an issue. Addressing the issue can often lead to knowledge helpful in understanding or improving a process or product. The interplay between how data should be collected, and the strength of the answers to the questions (i.e., conclusions) will be covered throughout this book.
1.1 Planning and Implementing a Study
In this section some guidelines and definitions for planning and implementing a study are given.
State study objectives
What do the stakeholders hope to learn from the experiment? Evaluating the impact of web page design on sales is an example of a study objective. A study may have multiple objectives.
Select responses
Which variable(s) will be used to evaluate a study’s objective? In the previous example sales or number of items sold could be used as a response variable to evaluate the objective.
Select study treatments and other covariates
A factor is a variable thought to affect the response variable. Factors can be quantitative or qualitative. Quantitative factors, such as temperature and time, take values over a continuous range. Qualitative factors, such as sex or marital status, take on a discrete number of values. The values of a factor are called levels. A treatment is a level of a factor in the case of one factor, and a combination of factor levels in the case of more than one factor.
Develop a study plan
Use the principles discussed in this book to develop a plan of the how the data will be collected.
Data collection
A plan describing the actual values of the factors used and how the response will be collected is very important.
Data analysis
A data analysis to evaluate the relationship between the factors and response variables appropriate for the experimental plan should be carried out.
Make conclusions/recommendations
Data analysis can be used to draw conclusions and make recommendations based on the effect of treatments on response variables.
1.2 Questions
Data can be used to answer questions such as:
- Does a new treatment, compared to no treatment, lower the death rate in people that have a ceratin disease?
- Does modifying the web page of an e-commerce site increase sales?
- Does increasing the amount of a chemical additive increase the stability of a product?
- Does changing body posture increase success in life?
1.3 Types of Study Investigations
Investigators can be defined as a group of individuals who carry out an investigation. Scientists, business analysts, or engineers often conduct empirical investigations to answer questions they hope will lead to new knowledge. This book is about designing two types of empirical investigations: experiments and observational studies. An experiment is an investigation where all the activities preceding data analysis, such as selection of experimental units and assignment of treatments to these units, can be controlled by the investigators. In an observational study some of these activities cannot be controlled by the investigators, especially the allocation of experimental units to treatments.
Example 1.1 The director of analytics for a political candidate wants visitors to the candidate’s website to register with the website by clicking a button on the website. The campaign staff debates what text the button should display and which images should be displayed on the landing web page. The campaign team is considering three buttons, and four different images (see Figure 1.1).
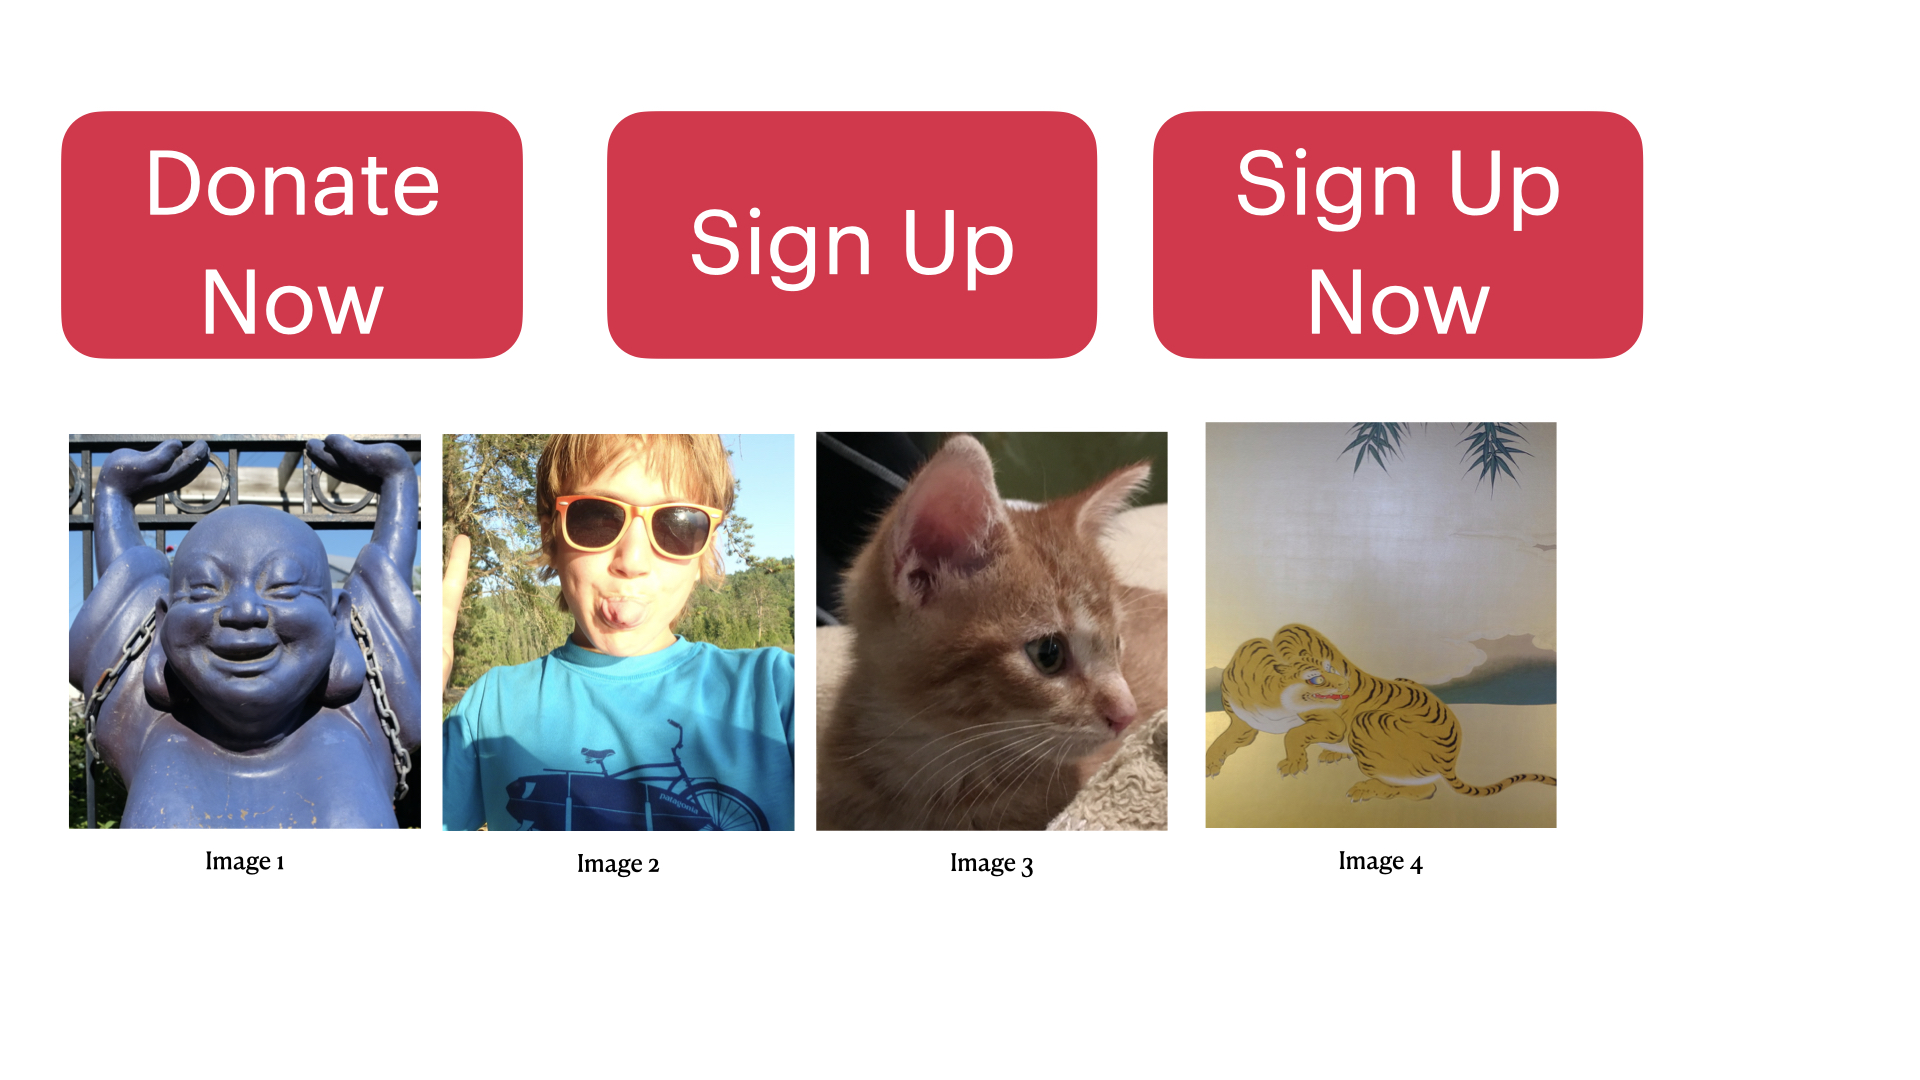
Figure 1.1: Web Page Buttons and Images
Framing a scientific question: A scientific question articulates a hypothesis that can be evaluated by collecting data. How can this issue be framed as a scientific question? Which button and which image lead to the highest number of visitors signing-up is an example of a scientific question.
Data collection: Empirical investigations involves collecting data. An important decision is what data to collect, and when and how it should be collected. For example, should the outcome measure used to evaluate success be number of clicks or number of people that clicked and signed-up? The campaign could change the landing page every few days to evaluate the 12 combinations (3 buttons \(\times\) 4 images), or visitors could be randomly assigned to one of the 12 landing pages over a week. Which data collection method will provide a stronger answer to the question?
1.4 Strength of Answers
In Example 1.1 the two methods discussed to collect data would generate a data set with the same variables, albeit different values of the variables. So, why worry about which method to use since the same statistical analysis can be done on both data sets? The answer lies in the strength of the conclusions that can be drawn from each data set. If the campaign changed the landing page every few days, then it’s plausible that the time a particular landing page is available could impact the characteristics of users that potentially view the page and ultimately decide to sign-up. Conversely, if all the pages were available at the same time, then only chance impacts which page a user views. This implies that any differences between the visitors that view landing pages should be random.
Experiments outline a plan for data collection and analysis, whereas undesigned or exploratory studies don’t outline a plan that can lead to data used to draw sound conclusions.
1.5 Why Design Scientific Studies?
Why should scientific studies be designed when so much data is already available and routinely collected? Available data is often insufficient and inappropriate to answer important questions. Dexamethasone is an inexpensive generic drug that some doctors thought could be useful in treating COVID-19 patients, but others disagreed. Studies of dexamethasone used to treat related illnesses suggested it might harm instead of help. A study designed by British investigators demonstrated that dexamethasone was able to reduce deaths, and explained when a patient with COVID-19 should be treated. Dexamethasone has become a staple of treatment for COVID-19. Even though data was already available on using dexamethasone, there was no data available on its use in COVID-19 patients. Designing scientific studies can lead to the collection of high quality data which in turn leads to more accurate information compared to having a large amount of lower quality data.4
Are statistical sampling and randomization still relevant in the era of Big Data? This question was asked by Professor Xiao-Li Meng.5 Meng considers the following: If we want to estimate a population mean, which data set would give us more accurate results, a 1% simple random sample or a data set containing self-reports of the quantity of interest that covers 95% of the population?
The total error is captured by the mean square error (\(MSE\)). The mean square error of an estimator \(\hat \theta\) of \(\theta\) is,
\[MSE = E\left({\hat \theta}-\theta\right)^2=Var\left({\hat \theta}\right)+\left(E\left({\hat \theta}-\theta\right)\right)^2.\]
In other words, \(Total \thinspace Error = Variance + Bias^2\). The term \(E\left({\hat \theta}-\theta\right)\) is called the bias of the estimator \(\hat \theta\). If the bias is 0 then the estimator is called unbiased.
Suppose we have a finite population of measurements \(\{x_1,..., x_N\}\) of some quantity, say the total number of hours spent on the Internet during a one-year period for every person in Canada. The population of Canada in 2015 is \(N = 35,749,600\) or approximately 35.8 million people.6 In order to estimate the mean number of hours spent on the Internet is it better to take a simple random sample of 100 people and estimate the mean number of hours spent on the Internet or use a large database (much larger than the random sample) that contains self-reports of hours spent on the Internet?
Suppose that \(\bar{x}_a\) is the sample mean from the database and \(\bar{x}_s\) is the mean from the random sample. X. L. Meng7 shows that \(MSE\left(\bar{x}_a\right) < MSE\left(\bar{x}_s\right)\) if
\[ f_a > \frac{n_s\rho_N^2}{1+n_s\rho^2},\] where \(f_a\) is the fraction of the population in the database, \(\rho\) is the correlation between the response being recorded and the recorded value, and \(n_s\) is the size of the random sample. For example, if \(n_s = 100\) the database would need over 96% of the population if \(\rho = 0.5\) to guarantee that \(MSE\left(\bar{x}_a\right) < MSE\left(\bar{x}_s\right)\). In our example this would require a database with 34,319,616 Canadians.
This illustrates the main advantage of designing and collecting a probabilistic sample and the danger of putting faith in “Big Data” simply because it’s Big!